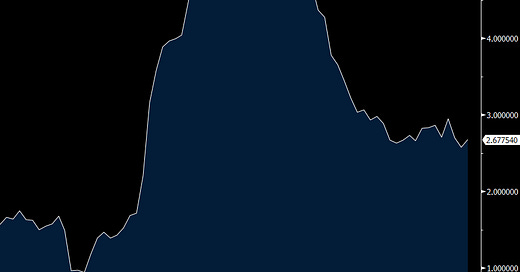
Inflation, income and spending stats
The May PCE inflation index rose one tenth headline and two tenths core m/o/m vs expectations of up one tenth for each. The y/o/y gains are 2.3% and 2.7% vs 2.2% and 2.6% in the month before. As these figures come weeks after CPI and PPI, they typically don’t deviate much from the estimates. Services inflation continues to drive the overall figure as it was up 2.7% y/o/y ex food and energy while goods prices were about flat, up by one tenth y/o/y. Though with goods, there are signs seen in both import prices and PPI for May that tariffs are beginning to show up. Import prices ex food/fuels rose .4% in May m/o/m after being up .5% in April as a reminder.
Of note was the weakness in personal income in May where it dropped by 4 tenths m/o/m instead of rising by 3 tenths as forecasted. A factor has been the ‘social security’ line item where payments here jumped 6.9% in April m/o/m (due to one time true up payments) only to fall back by 7.3% in May. Also, ‘farm’ income has been all over the place. Up 51% in March and 19% in April only to fall by 50% in May, all m/o/m. Also of note was the 2.2% monthly gain in ‘unemployment insurance’ which is the quickest one month increase since last year.
Keep reading with a 7-day free trial
Subscribe to The Boock Report to keep reading this post and get 7 days of free access to the full post archives.


