

How big is big? H/t my friend Luke Groman for finding this chart:
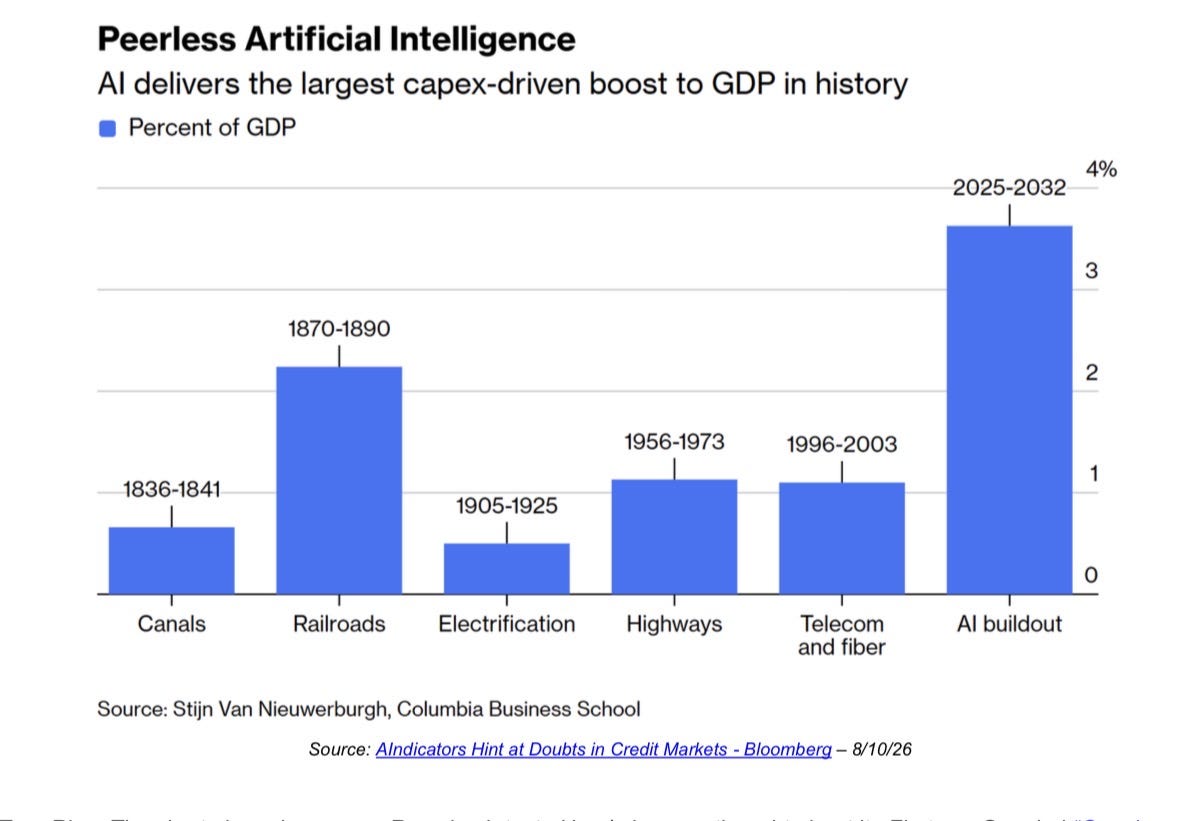
The ever growing demand for capital to fund this as cash flows deteriorate has all the players, led by Nvidia, get as creative as can be to convince the rest of us to lend and that includes the rest of the world in bonds denominated in a variety of foreign currencies (Alphabet is currently offering a A$5b bond issuance in Australia). I continue to believe the benefits of GenAI from here will be accruing to the users of the technology, not the builders, because of not just the massive amount of capital being spent but also the large amount of maintenance CapEx going forward from here that will inevitably result in lower returns relative to their cash flowing gushing past. Add in the price wars with the Chinese and the intense competition that results at a level last seen in the 1980s with the Japanese.
Maintenance CapEx will include huge lease obligations and the need to constantly refresh the equipment in these buildings, on top of the non-cash, but earnings drag, of higher depreciation expenses for years to come that results in the need for that refresh.
I’ll say again, the US economy, US stock market, US earnings growth trajectory, and US profit margin story is all in on this CapEx binge. The technology benefits will be tremendous as seen in prior binges in the past but rarely without a low price tag.
While the cost of capital doesn’t matter to the spenders at current rates, it still is something they have to deal with. I highlighted the widening spreads in CCC and I’m watching to see if that is a result of rising default rate fears and/or the entire fixed income world getting flooded with supply and the lowest quality is suffering first. Will widening spreads at the bottom move up the credit ladder?
Japanese bond yields continue to break out with fresh 30 yr highs in both the 2s and 10s. Again, we must keep watch because of the global influence this has. Also, old news but Q2 GDP for Japan rose 1.1% q/o/q annualized and that was below the estimate of 2% and 3 tenths of the REAL weakness was because the price deflator was 3 tenths above the forecast. Business spending was a particular drag.
