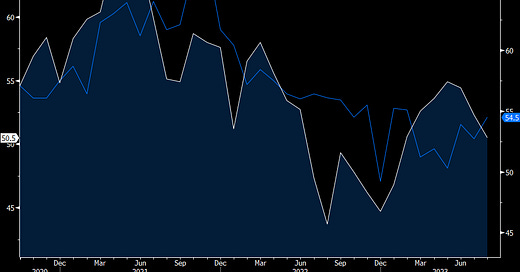
For full picture on US Services sector, don't just read the ISM release
Before I get into the ISM services index, it’s important to combine it with the S&P Global measure on services because they tell 2 different stories but some of that is likely due to the differing composition of each. ISM services rose to the highest since February while the S&P Global services PMI declined to the weakest since January. The likely reason for the differential is because the latter does not include ag, mining, construction, utilities and retail and wholesale trade. Ag is doing ok because of elevated crop prices, as is mining. Construction is likely benefiting from the manufacturing factories being built in response to the government’s legislative initiatives with green, semi’s and infrastructure but also new home builds. ISM also pointed to “utility contractors in high demand.” Also, S&P Global asks questions of small and medium sized businesses in addition to large ones, whereas ISM is mostly focused on large companies.
The August ISM services index rose to 54.5 from 52.7 and that was 2 pts above expectations. New orders rose 2 pts to 57.5 but backlogs plunged by 10.3 pts to 41.8 after jumping by about 8 pts in July. Inventories jumped by 7.3 pts to 57.7. Employment improved by 4 pts to 54.7, though only 8 of 18 industries saw an increase vs 10 in July. Prices paid was up by 2.1 pts to 58.9, a 4 month high.
Here are comments from businesses surveyed in ISM but not in S&P Global. I mentioned the quote on utilities from a company in that sector, but here is one from a construction business, “Sales on a national level have been strong.” There is no color though on exactly what type of construction but could also be housing. In mining, “Steady oil and gas production and sales volume. Declining commodity prices seem to have bottomed out.”
Keep reading with a 7-day free trial
Subscribe to The Boock Report to keep reading this post and get 7 days of free access to the full post archives.


