A bunch of interesting things here on home prices, credit spreads, CRE debt, rig counts, U-Haul, & signs of mfr'g recovery
You want to reignite the talk of a July Fed rate cut? Maybe a 4% handle on Friday's payroll unemployment rate will do it, especially as the March dot plot has a year end 2024 median unemployment rate estimate of 4%. The current estimate is 3.9% which happens to be the highest since January 2022.
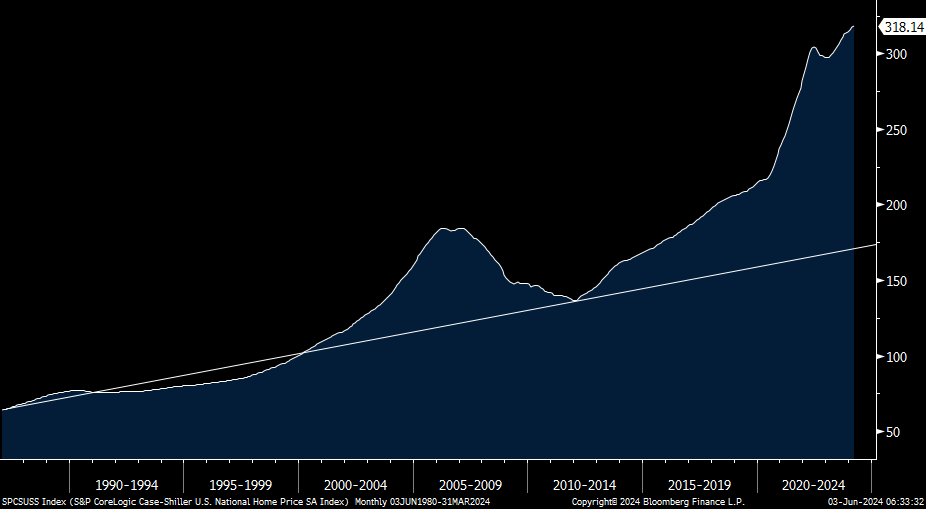
Why are so many frustrated by the economy as seen in polls? It's obviously inflation but in particular the high cost of housing, whether to buy or rent. I decided to look at the S&P CoreLogic Case Shiller index to see where it would be if it remained on trend since the beginning of the data in 1987. Just drawing a simple trend line has this index 85% above the trend line. It was 50% above in 2007 for reference and got back to it in 2012 when prices collapsed. The 2nd chart is a trend line I drew for the median home price within the existing home sales data. It's 63% above its trend line vs the 33% it was in 2007.
So when you hear your baby boomer relative tell you that 'when I was your age I had a 12% mortgage rate', the price paid then for a home was much cheaper relative to one's income.
S&P CoreLogic Home Price Index
Existing Home Sales Median Home Price
I haven't mentioned it in a while but wanted to circle back to the CCC rating category of high yield and quietly the spread to Treasuries looks like it's carving out a bottom at 803 bps, it's the highest since late April. It still is VERY tight but something to keep our eye on. Putting aside spread and looking at the yield itself, it's at 12.8%, expensive.
Keep reading with a 7-day free trial
Subscribe to The Boock Report to keep reading this post and get 7 days of free access to the full post archives.


